What an Accurate Rainfall Forecast Can Still Miss
AI weather forecasts can capture where rain will fall while underestimating its heaviest bursts. Research in South Korea and Europe reveals why the difference matters.
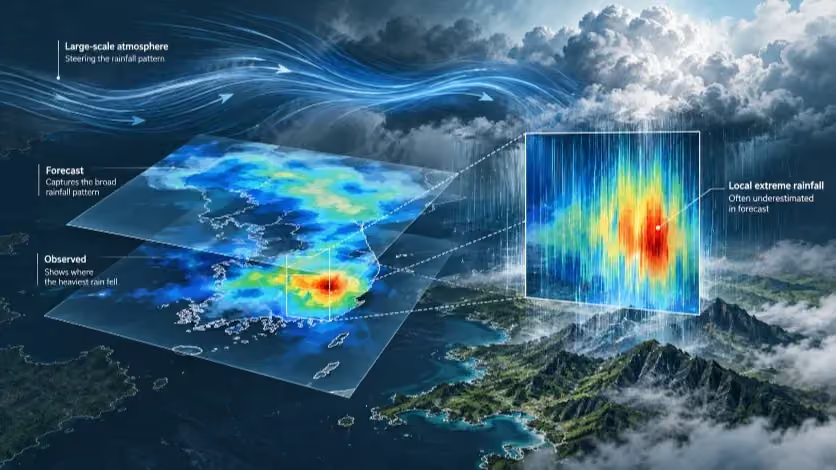
New studies in South Korea and Europe expose a gap between predicting where rain will fall and anticipating its most intense concentrations. As artificial intelligence enters operational forecasting, the distinction is becoming central to how progress is measured.
During ten of South Korea's wettest days in the summer of 2020, GraphCast often recognized the broad distribution of rain but failed to reproduce its strongest concentrations. In a study published this September, the AI model missed observed 24-hour rainfall peaks exceeding 100 millimeters on eight of the ten days. Its median spatial correlation with rain-gauge measurements nevertheless reached about 0.54, above the roughly 0.46 recorded by a conventional numerical simulation operating at a comparable horizontal resolution. The model could perform better at tracing the pattern across the country while performing worse at representing the heaviest rain within it.
That difference matters because the scores describe distinct forecasting capabilities. A spatial correlation measures the resemblance between the overall geographical patterns of predicted and observed rainfall; it does not establish that the wettest locations received the right amounts in the forecast. The September study, conducted by researchers in South Korea and published in Theoretical and Applied Climatology, tested the older GraphCast against the Weather Research and Forecasting model (WRF) using measurements from 549 stations. It was a reconstruction of ten selected historical cases, not an audit of warnings issued to the public in 2020. Within that experiment, the disagreement between the broad pattern and the local peak was substantial enough to warrant a closer look at the atmosphere the models had simulated.
What the mountains revealed
The Sobaek Mountains supplied a physical test of that disagreement. Moisture carried into the southern peninsula by southwesterly winds can intensify precipitation when the air is lifted over higher terrain. Across the ten selected days, gauges in the terrain-influenced region recorded approximately 20 millimeters more rain over 24 hours, on average, than stations in a comparison region at similar latitudes. GraphCast generated only about 8 millimeters of additional rainfall. WRF produced about 14 millimeters on its 27-kilometer grid and about 18 on its 3-kilometer grid. These are differences between two regions, not forecast-accuracy percentages. They measure how much of an observed increase associated with terrain appeared in each simulation.
The discrepancy cannot be explained simply by assuming that GraphCast failed to bring enough water toward South Korea. Its simulated integrated water vapor transport averaged 698 kilograms per meter per second in the study's comparison area, against 722 for the 27-kilometer WRF simulation—a difference of about 3 percent. Yet GraphCast produced weaker upward motion over the mountains and substantially less rainfall enhancement. Similar large-scale moisture transport had led to different accounts of what happened when that air encountered the terrain.
Resolution contributed to the distinction without fully explaining it. The GraphCast version used in the study had a grid spacing of roughly 25 kilometers; WRF was tested at 27, 9 and 3 kilometers. To examine whether the finer detail alone explained the WRF advantage, the researchers also evaluated the higher-resolution WRF rainfall fields after adjusting them to a common 27-kilometer grid. Those simulations still reproduced roughly 64 to 88 percent of the observed terrain-related rainfall enhancement, against GraphCast's approximately 42 percent. The gap persisted when the outputs were evaluated at comparable spatial scales.
SOUTH KOREA · SOBAEK MOUNTAINS · 2020
Where the forecast lost the mountains' extra rain
Average difference in 24-hour rainfall between the terrain-influenced region and a comparison region, on 10 selected heavy-rain days.
REGIONAL RAINFALL DIFFERENCE · 0–20 MM
GraphCast captured a smaller regional contrast. Greater horizontal resolution did not produce a steadily larger contrast across the three WRF grids.
The result points toward differences in how the systems generated local precipitation, but it does not assign the entire gap to an AI algorithm. The WRF results averaged 27 configurations of physical processes; GraphCast supplied a single simulation. WRF began its runs earlier, partly to allow the numerical model to stabilize, and the two systems differed in more than resolution. Those conditions prevent a clean experiment in which every factor except the forecasting method is identical. They do not erase the measured result: in these ten cases, a credible regional rainfall pattern and an inadequate local rainfall peak appeared in the same AI forecast.
Nor is that weakness a permanent property of every AI model. A study published in npj Climate and Atmospheric Sciencein December 2025 tested a regional AI system with a 6-kilometer grid over the western United States. Trained with finer regional data, it represented high-end precipitation more realistically than a coarser global AI model and competed with a specialized regional WRF system in atmospheric-river cases. It still underestimated some of the very largest totals, and winter storms along the American West Coast are not the same forecasting problem as Korean summer downpours. The improvement nevertheless demonstrates that model design, regional training and resolution can change the extreme-rainfall result. The Korean experiment identifies a limitation of the models tested there, not the ceiling of the technology.
A threshold can be right when the rainfall amount is wrong
A second Korean study reveals a different way strong rainfall can escape a seemingly favorable score. Published earlier in 2026 in Weather and Climate Extremes, it compared four machine-learning weather models and their ensemble with South Korea's Korea Integrated Model (KIM), using 2023 weather. The researchers separately examined heavy-rainfall episodes and the ability of forecasts to identify whether a station would cross specified rainfall thresholds. The two assessments gave different pictures of GraphCast's performance.
For the six hours ending at 9 a.m. on July 15, 2023, satellite-derived GPM IMERG precipitation estimates showed an intense rainfall band over central South Korea, including the wider Osong area. Both KIM and the AI models represented the broad position of that band in their one-day forecasts. But in the geographic area used for the comparison, the satellite product indicated a six-hour rainfall maximum of approximately 80 millimeters. KIM's simulated maximum at one- and three-day leads came close to that estimate, while the AI models produced roughly half to two-thirds of it. GraphCast depicted stronger rainfall than FuXi, another AI model, but neither reproduced the concentration as faithfully as KIM in this case.
That comparison used a satellite estimate of the maximum within a defined area, not the rainfall recorded at the precise site of the Osong disaster. It did not establish what forecasters or emergency officials had actually received and acted on in July 2023. It did establish a difference between simulations: the model that drew the larger rainfall band could still assign too little rain to its most intense part.
Across 97 Korean weather stations, however, GraphCast did better at identifying threshold exceedances. At a one-day forecast lead and a six-hour threshold of 10 millimeters, its Critical Success Index (CSI) was approximately 0.47, compared with KIM's 0.38. At 30 millimeters in six hours, GraphCast led again, about 0.20 against KIM's 0.12. CSI counts correct predictions that a threshold will be crossed against those correct predictions, missed exceedances and false alarms. It is not the percentage of all weather forecasts that were correct, and it is not a direct measure of the rainfall amounts predicted beyond the threshold.
A forecast of 40 millimeters where 80 millimeters actually falls counts as a correct detection at a 30-millimeter threshold. The intensity error remains 40 millimeters; the categorical score does not measure it. Conversely, a forecast of 29 millimeters for an observed 30 millimeters counts as a miss. These examples describe the scoring rule, not the model output at Osong. They explain how GraphCast could rank ahead of KIM on a station-based occurrence measure and still be less accurate in a separate test of the maximum intensity near Osong. The two tests also used different observational references—ground gauges and satellite-derived precipitation—and cannot be combined as though they were the same sample.
The higher threshold exposed considerable uncertainty. The study recorded 2,824 station-level rainfall occurrences meeting the 10-millimeter criterion, but only 429 meeting 30 millimeters, aggregated across the network in 2023. These were correlated station occurrences, not hundreds of independent storms. Both models' CSI scores declined sharply at the heavier threshold, and the authors' bootstrap analysis reflected the greater sampling uncertainty. GraphCast had the higher reported point estimate, but its approximately 0.20 CSI left substantial room for missed events and false alarms. A higher score for detecting a category of rain did not settle how well the most intense rainfall was represented.
The ranking changes with the rain
The difference between a general rainfall score and a heavy-rainfall score also appears outside Korea. In a peer-reviewed study published on October 13, researchers evaluated GraphCast, AIFS Single 1.0, FuXi and an observation-corrected regional WRF configuration across three flood-related periods in Luxembourg and the surrounding region. The evaluation contained 92,119 matched station–time pairs from roughly 90 simulated days around events in 2016, 2018 and 2021. Every system was compared against the same observations at matching times, although the regional WRF ran on a finer grid and incorporated observations into its atmospheric analyses while the AI systems used their own global configurations.
At a threshold of 1 millimeter in six hours, GraphCast had the highest CSI, 0.424, narrowly ahead of AIFS at 0.415 and WRF after data assimilation at 0.389. At 10 millimeters, AIFS led. At 20 millimeters, WRF moved ahead with a CSI of 0.160, compared with AIFS at 0.141 and GraphCast at 0.114. A change in the rainfall condition being tested—not a change of study region or verifying station network—altered which model appeared strongest.
EUROPEAN FLOOD-PERIOD COMPARISON · SIX-HOUR RAINFALL
A different rainfall threshold, a different leading model
The same evaluation changes when the question shifts from detecting at least 1 mm of rain to detecting at least 20 mm within six hours. Both panels use the same CSI scale (0–0.45).
THRESHOLD 01
≥1 mm in 6 hours
Highest CSI: GraphCast
GraphCast 0.424
AIFS Single 1.0 0.415
WRF (data assimilation) 0.389
0CSI0.45
THRESHOLD 02
≥20 mm in 6 hours
Highest CSI: WRF (data assimilation)
GraphCast 0.114
AIFS Single 1.0 0.141
WRF (data assimilation) 0.160
0CSI0.45
At ≥20 mm, even the leading model missed most observed exceedances. WRF detected 21.6% of them; 61.9% of its predicted exceedances were false alarms. These percentages have different denominators.
GraphCast's mean six-hour rainfall bias across the evaluation was only +0.043 millimeters. That number looks almost perfect until it is placed beside the high-threshold results. Overpredictions in one set of conditions and underpredictions in another can cancel in an average, leaving a small mean error without accurate reproduction of the most intense events. The European study made a more fundamental point than a reversal in model rankings: a forecast can be nearly unbiased in its overall rainfall amount and still have weak skill at identifying extreme accumulations.
Even WRF, the highest-scoring model at 20 millimeters, detected only 21.6 percent of observed threshold exceedances. Of the exceedances it forecast, 61.9 percent were false alarms. Relative superiority should not be mistaken for reliable detection. The statistical evidence was also unequal across comparisons. WRF's CSI advantage over GraphCast at the 20-millimeter threshold was 0.046, with a paired 95 percent bootstrap interval from 0.009 to 0.096; its smaller advantage over AIFS depended more on the temporal block length used to account for correlated observations. And the main high-threshold ranking was computed across the wider event windows. A narrower check restricted to flood days tested the 1-millimeter threshold, not whether the 20-millimeter ordering persisted on those days alone.
The limitations help define the finding rather than cancel it. The study establishes that, within the observed European sample, the choice of rainfall threshold substantially affected performance rankings and that strong-rain detection remained difficult even for the top scorer. It does not establish that an AI model available in 2026 is inferior for every future European or Korean downpour. In particular, the AIFS 1.0 evaluated in the paper was not the operational version ECMWF was running when the study appeared.
The forecast starts before the AI runs
In May 2026, the European Centre for Medium-Range Weather Forecasts upgraded its physical Integrated Forecasting System to Cycle 50r1 and its operational AI Forecasting System to AIFS Single v2. The simultaneous change followed a revealing test. Supplying analyses from the upgraded physical system to several older AI models reduced their skill on some atmospheric variables. The weather center had improved the system that estimated the atmosphere's starting condition, but not every AI model benefited from the new input.
A forecast's starting field is an analysis built by combining observations with a physical representation of the atmosphere. AI models learn from historical analyzed fields and then use a current analysis to begin predicting the future. When the operational analysis changes its statistical characteristics, a model trained or fine-tuned on the earlier data can respond differently. ECMWF found that GraphCast, Aurora and AIFS v1.1 lost some skill with the proposed 50r1 analyses, while Pangu-Weather and FourCastNet were largely unaffected in the variables tested. The detailed European results concerned mainly temperature, wind and upper-air fields, not an experimental measurement of Korean extreme rainfall.
ECMWF tested how to adapt AIFS. Using only a short period of the new prototype analyses for an extra training stage worked less well than mixing that material with the older operational training data. The resulting v2 model was tuned to work with the upgraded analyses, and ECMWF retired the live experimental feeds of several older external AI models while continuing its own operational AI forecasts. Some measures still deteriorated, including particular near-surface temperature results in Arctic conditions. This was not a retreat from AI forecasting. It was evidence that a fast, powerful model has to be maintained as part of a changing observing, analysis and training system.
South Korea's meteorological agency described a closely related concern at the September 2026 European Meteorological Society meeting. KMA researchers said they had tested GraphCast, Pangu-Weather and FourCastNet with initial analyses from KIM, the UK Unified Model and ECMWF. With matched starting conditions, GraphCast and Pangu-Weather often outperformed their conventional counterparts. But the results also changed with the source of the initial analysis. The researchers pointed to two possible contributors: the quality of the starting state and the closer match between ECMWF-derived training data and ECMWF-derived initial fields. The published conference abstract does not supply the detailed heavy-rainfall verification tables needed to separate those effects quantitatively.
The practical implication is more exacting than saying that better data make better AI. The forecast depends on the particular model version, the atmosphere supplied to it and the relationship between that input and the model's training. The historical Korean comparisons used an older KIM configuration; the October European study used AIFS 1.0. Neither can be presented as the measured severe-rainfall performance of the updated systems operating in South Korea or at ECMWF later in 2026.
Different clocks inside Korea's warning system
South Korea's forecast infrastructure now combines technologies that answer different questions on different timescales. In April 2026, KMA moved to sole operational use of an eight-kilometer version of its global KIM numerical model, according to its own public account. Its 2025 Typhoon White Book also describes experimental real-time guidance from global AI models supplied to forecasters through an internal site since 2024. Those experiments are not equivalent to replacing the agency's public forecast process with GraphCast or another standalone AI system.
At the shorter end of the forecast horizon, the National Institute of Meteorological Sciences has developed NowAlpha, a radar-based AI precipitation model. A July 2026 KMA description specifies one-kilometer spatial spacing, ten-minute output intervals and predictions of rainfall distribution up to six hours ahead. A one-kilometer grid describes the detail of the output, not an eightfold improvement in accuracy over an eight-kilometer model. Nor is a radar-based six-hour projection interchangeable with a global forecast intended to describe the atmosphere days ahead.
Short-range radar systems face a problem that a simple extrapolation of a rainband's movement cannot solve: precipitation cells grow, decay and reorganize. KMA Weather Radar Center researchers reported adding a RainNet-based prediction of echo growth and decay to their MOTION nowcasting approach. At the 2026 meteorological conference they reported an 11 percent reduction in mean absolute percentage error over a 2024 validation period for forecasts up to two hours, and another 10 percent improvement relative to the initial AI version after a 2025 update. The gains were reported by the developers, involved different comparison baselines and were not measurements of rare-event detection or public-warning outcomes. The available documents also do not establish that NowAlpha and the modified MOTION system are one operational product.
The separation of functions continues into public notifications. KMA radar researchers described an app in which notification of the expected start of rain uses a MOTION forecast, while the heavy-rain notification uses radar-derived rainfall estimates and an intensity threshold. The team also modified repeat-notification rules to reduce missed or redundant messages. These are different changes: one concerns an estimate of approaching precipitation, another the measurement of rain already present, and a third how that information reaches a person. None can be evaluated solely by the global AI models' six-hour rainfall CSI.
Formal heavy-rain warnings use another standard. KMA's warning criteria include expected accumulation of at least 90 millimeters in three hours or 180 millimeters in twelve hours. On July 17, 2026, the agency sent a newly introduced extreme-rainfall emergency message to Jisan 1-dong in Daegu at 10:10 p.m., under rules triggered by observed rainfall reaching 100 millimeters in an hour or simultaneous 85-millimeter hourly and 25-millimeter fifteen-minute totals. The message recorded a dangerous observed condition and the activation of a particular alert. It was not itself a test of what KIM, GraphCast or a radar AI model had predicted hours earlier.
SOUTH KOREA · OFFICIAL RAINFALL WARNING CRITERIA
Forecast rain and measured rain trigger different alerts
The figures describe different decisions, not competing predictions of the same rainfall event.
EXPECTED RAINFALL
Heavy-rain warning
A forecast meets either threshold:
≥90 mm in 3 hours
OR
≥180 mm in 12 hours
OBSERVED RAINFALL
Extreme-rain emergency message
Measurements meet either condition:
≥100 mm in 1 hour
OR
≥85 mm in 1 hour
AND
≥25 mm in 15 minutes
An emergency message based on measured rainfall confirms a dangerous observed condition. It does not, on its own, tell us how accurately the rain was predicted in advance.
The performance question left open by this increasingly layered system is not whether AI has entered Korean forecasting; official records establish that it has. It is whether the specific forecast outputs available before a dangerous rainfall episode can identify the relevant intensity and location with useful advance notice, and whether those predictions improve the information that reaches the public. The published research has not yet made that comparison for Korea's 2026 operational configuration. A gauge reading, a simulated rain field and a text-message timestamp describe different parts of the sequence; they cannot be combined into a claim of better warnings without the corresponding archived forecasts and decisions.
The distinction returns the story to the missing rainfall peaks in the Korean experiments. Knowing that a rainband will cross a region is useful. Identifying a six-hour threshold at a weather station is useful too. But neither result establishes the maximum accumulation over a particular mountainside, neighborhood or catchment, and even the correct precipitation amount does not by itself predict how a river or drainage system will respond. The evidence needed to establish an improvement depends on the decision being made: the relevant accumulation period, forecast lead, location tolerance, missed events and false alarms must match the hazard being anticipated.
The advance of AI has made forecasts faster to generate and, in particular comparisons, more skillful. It has not eliminated the differences between forecasting the path of moisture, the concentration of rain and the timing of a warning. The most useful measure of progress in extreme-rain forecasting is whether those distinctions narrow in the operational forecasts issued before the heaviest rain falls—not whether a model's name moves up a general accuracy ranking.
Continue this reporting
Reporting on the same issue
Related coverage selected from the article's desk, topics and newsroom relationships.
 NewsOct 7, 2026
The Moon’s Industrial Future Begins With What Missions No Longer Need to Carry
Water, sunlight, safe landing terrain, communications and power do not natura...
 NewsOct 2, 2026
AI Is Reallocating the World’s Memory Factories
AI demand is forcing memory makers to decide how scarce DRAM capacity is divi...
 NewsSep 2, 2026
The Ship Is Already a Sensor
Modern merchant ships already carry dense networks of sensors, radios and com...
More from the author
More from this byline
Stay with the same line of reporting through more work from this byline.
- NewsOct 2, 2026
AI Is Reallocating the World’s Memory Factories

Reader Signal
Community readWhat did this report leave you with?
Choose the signal that best reflects your reading. Select it again to remove it.
One response per article
No response selected
A moderated conversation about the reporting.
One-level replies and newsroom moderation keep the conversation anchored to this article.
Discussion Status
Open
Please sign in to join the discussion.
Newsletter
Weekly reporting and context from Busan and Korea.