The Shipping Networks Behind Busan Port’s Global Reach
ONE invested in a Busan terminal as CMA CGM launched a Japan–Europe route without Busan. Their decisions reveal the economics of transshipment, direct services and Arctic trade.

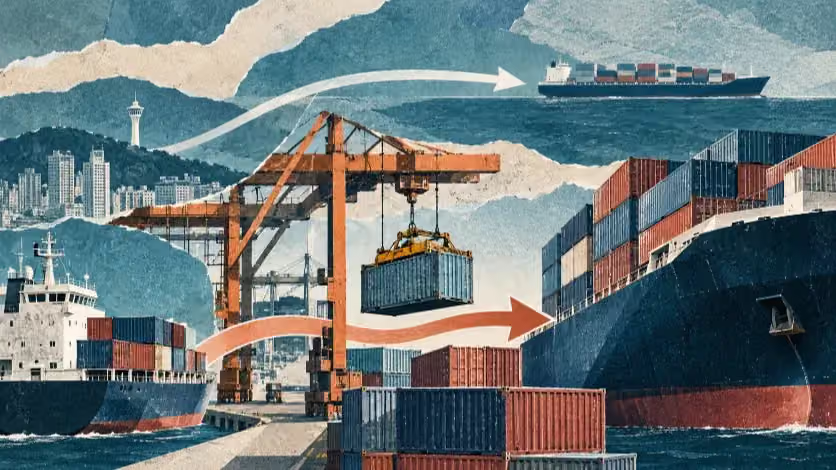
ONE invested in a Busan terminal as Japan–Europe services shifted. Chinese direct routes, Russian Far East trade and Arctic voyages reveal the economics behind the port’s global shipping role.
In March 2026, Ocean Network Express took an indirect stake in Dongwon Global Terminal Busan, an automated container terminal at South Korea’s principal port. The Singapore-headquartered carrier, formed from the container businesses of three Japanese shipping companies, said the investment would help it secure terminal capacity and manage cargo transfers more reliably. It was committing capital to a port already central to its revised East–West network: ONE’s published 2026 schedules included a Europe-bound mainline service calling at Busan, supported by short-haul feeder services bringing cargo from Tokyo, Kobe and Nagoya.
Another major carrier was organizing Japanese cargo differently. CMA CGM introduced a weekly service collecting containers at Kobe, Nagoya and Yokohama, then at two ports in southern China, before sailing to northern Europe without calling at Busan. The French line could combine cargo from both countries on the same vessels. ONE chose to assemble Japanese freight through a Korean connection; CMA CGM offered a sailing on which those containers would remain aboard the ocean-going ship. The carriers’ announcements establish their intended networks, not a comparison of actual shipper bills or punctuality. ONE’s terminal investment adds a longer-term financial commitment to one of those networks; CMA CGM’s direct service demonstrates why the Korean port still has to compete for each carrier’s traffic.
Network comparison / 2026 announced services
One market, two ways to reach Europe
Selected service connections for Japan-origin cargo. These are published network plans, not observed individual shipments or comparable freight quotes.
ONE / JAPAN SHUTTLE + FE4
Feeder connection followed by a mainline vessel change in Busan
01 / JAPAN SHUTTLES
Kobe · Nagoya · Tokyo
Ports served on the dedicated Japan–Busan shuttle loops; order varies by loop.
TRANSFER AT BUSAN / change to FE4
02 / EUROPE-BOUND MAINLINE
Busan · Rotterdam · Hamburg · Le Havre
FE4 westbound calls in ONE’s April 2026 published rotation.
CMA CGM / OCEAN RISE EXPRESS (OCR)
Advertised direct Japan–North Europe mainline: no Busan call
JAPAN BOARDING CALLS
Kobe → Nagoya → Yokohama
SOUTH CHINA CALLS
Xiamen → Yantian
NORTH EUROPE CALLS
Rotterdam → Hamburg → Southampton
The advertised round trip then returns via Nansha to Kobe; this panel shows the Europe-bound leg.
Commercial distinction: ONE accepts an intermediate vessel connection at Busan; OCR assembles Japan and China cargo on a Europe-bound mainline.
ONE announced an indirect stake in Dongwon Global Terminal Busan on March 24, 2026. No exclusive terminal rights or minimum cargo commitment is disclosed here.
Sources: ONE, 2026 Asia–Europe and Japan shuttle service plans (April 2026); CMA CGM, OCR launch announcement (February 27, 2026); ONE, DGT announcement (March 24, 2026). Announced routes do not establish actual shipment times or reliability.
Busan handled 24.88 million twenty-foot equivalent units, or TEUs, in 2025. Transshipment accounted for 14.10 million TEUs, approximately 57 percent of the port’s container handling. The figures include container movements and empty equipment; they do not measure the value of the cargo or count unique shipments. More than half of Busan’s recorded business nonetheless came from freight changing vessels rather than entering or leaving South Korea as domestic imports or exports. Its customers include shipping companies moving Japanese, Chinese and other foreign cargo between markets in which Korea may be neither the origin nor the destination.
Busan’s connections were built on South Korea’s industrial export growth and successive investments in deepwater container facilities. The opening of New Port in 2006 provided room for larger vessels and helped shift the concentration of international transshipment away from the older harbor. Manufacturing cargo generated in Korea gave carriers a reason to call, while feeder arrivals from nearby foreign markets increased the cargo available on those services. Frequent mainline departures then made Busan more useful to smaller ports, reinforcing the demand for feeders. The process created an international transport business whose customers and commercial decisions extended well beyond Korea’s border. Its scale is real, but the network has to keep attracting vessel space and cargo; location alone cannot preserve the pattern.
In the third quarter of 2026, Busan’s transshipment handling rose 20.3 percent from a year earlier to 4.09 million TEUs, while import-export handling slipped 0.3 percent. China-related transshipment rose 25.9 percent. South Korea’s Ministry of Oceans and Fisheries linked the expansion to international service changes and congestion at Chinese ports following typhoons, although European-related transfer activity had begun rising earlier. A quarterly increase does not reveal how much business will remain after disrupted services return to their usual schedules. A temporary diversion fills terminal space; a recurring carrier commitment can support investment and service planning over a longer period. A record quarter that includes temporary diversions offers a weak basis for facilities expected to operate for decades.
Port ledger / TEU handling
More cargo transfers, not more Korean imports
Two separate reporting periods show the structure of Busan’s business and the source of its recent growth.
A / FULL YEAR 2025 · 24.882 MILLION TEU
56.7% · Transshipment
14.097 million TEU
43.3% · Import–export
10.785 million TEU
B / JULY–SEPTEMBER 2026 · YEAR-OVER-YEAR CHANGE
Transshipment handling
4.09 million TEU in Q3
+20.3% ↑
Import–export handling
2.68 million TEU in Q3
−0.3% ↓
The 2025 panel is a share of annual total; the Q3 panel reports separate year-over-year rates. They are not one time series or a shared percentage scale.
TEU measures container handling in twenty-foot equivalent units, including empty equipment. It is not a count of distinct shipments, Korean exports or port profit. Sources: Busan Port Authority, 2025 terminal totals; Ministry of Oceans and Fisheries, 2026 Q3 port throughput release (October 29, 2026). Shares rounded to 0.1 percentage point.
Japan’s Cargo and the Busan Connection
Japan’s relationship with Busan exposes a conflict between national transport policy and the choices made by manufacturers and shipping lines. Tokyo has spent years trying to concentrate cargo at its Keihin (Tokyo–Yokohama) and Hanshin (Osaka–Kobe) gateway complexes, with the aim of preserving direct sailings to major overseas markets. The Ministry of Land, Infrastructure, Transport and Tourism found that the share of Japan–Europe container trade moved without overseas transshipment had fallen from 69.1 percent in its 2013 survey to 42.3 percent in 2023. The decline did not all accrue to Busan; Japanese freight can be transferred at several Asian ports. It nevertheless documents why access to foreign hubs has become a matter of concern for the Japanese government.
A January 2026 transport ministry committee discussed that dependence as an economic-security problem. Participants warned that losing direct European services could increase inventory and handling costs for Japanese businesses. They called for faster domestic port development and stronger cargo concentration. Some also argued that Busan or Singapore might be useful alternatives for particular shipments, including in contingency planning. Those were opinions recorded in committee proceedings, not a decision by Tokyo to make Busan part of an official security strategy. The discussion laid bare the competing considerations: Japan would prefer to retain control over more of its direct maritime access, but exporters still need commercially viable routes when a domestic port cannot attract an appropriate mainline sailing.
The economics differ across Japan’s industrial geography. A manufacturer near a small regional port may face a long, expensive inland journey to Yokohama or Kobe. A feeder ship to Busan offers access to more international departures without first moving the container across much of Japan. That option introduces another vessel transfer and the risk of missing a connection. Its value depends on the shipper’s origin, destination, cargo, through rate and delivery commitment, not on an inherent superiority of a Korean or Japanese port. Busan Port Authority advertised a roughly 30 percent cost saving for a hypothetical Niigata–Hamburg movement through Busan during a February 2026 marketing visit; the authority did not disclose comparable freight quotations or assumptions sufficient to independently verify the claim.
A study published in the Journal of Transport Geography in October 2026 provides a more systematic view of the relationship. Using Japanese cargo-flow records, including a 2018 survey, David Guerrero and his coauthors found that feeder connectivity with Busan was associated with stronger export-cargo capture for certain regional Japanese ports, particularly over relatively short inland distances. The association was less consistent for imports. The survey dates limit its use as evidence about current market shares, but its geographical finding explains how a foreign hub can serve Japanese regional manufacturers without replacing the country’s principal gateways.
ONE’s reorganization supplies a contemporary example of that network in use. In a May interview with the Japanese shipping newspaper Nihon Kaiji Shimbun, ONE Japan president Jun Toda explained that the carrier was separating Japanese Europe-bound cargo from a long vessel rotation whose European delays had affected other services. The cargo would move by feeder to Busan and connect with FE4. Toda acknowledged customer unease over transshipment and said the carrier was paying close attention to connection reliability. In the same interview, Toda connected ONE’s greater involvement in Busan terminal operations, including its equity participation, to closer monitoring and control of transshipment. His account is a carrier’s explanation of its strategy, rather than an independent measurement of punctuality. ONE’s published service plan separately confirms the FE4 rotation through Busan and the dedicated Japanese feeders.
ONE’s indirect stake in Dongwon Global Terminal Busan commits capital to the infrastructure through which some of its international cargo can pass. Terminal investment changes the carrier’s exposure to operational quality beyond a single voyage, although neither the equity percentage nor any minimum throughput agreement has been publicly disclosed. The investment and the revised Japanese feeder network reinforce the commercial importance of dependable connections; they do not establish how many additional TEUs ONE will handle at the terminal or how quickly delays will fall.
China’s Direct Routes and Rival Hubs
Chinese manufacturing gives Shanghai and Ningbo-Zhoushan a different foundation for international shipping. Shanghai handled more than 55 million TEUs in 2025 and Ningbo-Zhoushan 43.87 million. Ningbo’s extensive sea–rail connections bring inland cargo to a coastal gateway before a container ship departs for Europe or North America. When enough shipments can be assembled for a direct sailing, a detour through Busan introduces handling and feeder costs that the customer may have no reason to pay. CMA CGM’s Japan–China–Europe service demonstrates how a carrier can gather sufficient cargo at several origins without a Korean transfer point.
Throughput alone does not capture the network available to shippers. UN Trade and Development’s port liner shipping connectivity index placed Busan fourth globally in the third quarter of 2026, behind Shanghai, Ningbo and Singapore but ahead of Qingdao, even though Qingdao handled more containers. The index describes the breadth and capacity of scheduled liner connections, not delivered freight prices or terminal profitability. Shanghai also conducts substantial waterborne transfer business, although its reported domestic-and-international water-to-water movements cannot be compared directly with Busan’s international transshipment category. China’s ports compete as both cargo-generating gateways and transfer centers.
Even Shanghai’s immense cargo base cannot prevent a carrier from omitting a call when it needs to recover a delayed schedule. In August 2026, ONE advised customers that selected North American services would omit Shanghai and use Busan to reconnect Shanghai-bound and Shanghai-origin containers. In September, it also planned to route affected Ningbo cargo through Busan after omitting a call on its PN3 service. Busan was already part of the PN3 rotation; the plan changed where cargo would transfer, rather than adding a new Busan call. Carrier notices confirm intended arrangements but not completed box counts. Chinese port congestion and network adjustments provided commercial openings for Korean terminals, while much of the underlying manufacturing freight still originated in China.
Shipping alliances amplify these changes. A 2024 network study warned that the newly planned Gemini Cooperation between Maersk and Hapag-Lloyd could weaken Busan’s position by excluding it from key mainline calls. Yet Maersk’s revised August 2026 AE19 service rotation listed Busan among its Asian calls on a service routed through Suez. The earlier study modeled a prospective network; the later carrier notice described a particular service plan, not proof that every sailing occurred as advertised. Read together, they show how precarious a fixed forecast of hub status can be. Alliance structures, regional cargo and security conditions at maritime chokepoints can change the routes on which ports are included.
Busan’s service network gives carriers an option when direct calls become inconvenient, but it does not give Korea control over the cargo produced in China or the network decisions made abroad. Maintaining a wide range of onward sailings makes the port useful during disruptions. Keeping that business when normal schedules resume depends on price and reliability, and the Chinese gateways have substantial resources to offer their own competing connections.
Russia’s Far East Shipping Link
The Russian Far East adds another maritime system to Busan’s regional business. FESCO announced on October 29, 2026, that it was adding a second 500-TEU ship to its Korea Soviet Direct Line linking Busan with Vladivostok, allowing departures approximately every four days. The company said it had carried more than 42,600 TEUs on the service in the first nine months of 2026, up 12 percent from a year earlier. Its reported traffic includes shipments moving in both directions and freight brought from Southeast Asia and smaller Japanese ports for connection through Busan. FESCO also offers inland rail services from Vladivostok to destinations across Russia and beyond. The figures are the operator’s reported service volumes, not an independently audited count of containers physically transferred in Busan.
A separate Russian operator has been assembling a similar connection. In February, Delo Group announced that a 744-TEU vessel had begun a twice-monthly service calling at Shanghai, Busan, Vostochny and Vladivostok. Its Vostochny terminal advertises rail services to central Russia, the Urals and the Volga region. Chinese ports also have their own direct services to Russia’s Far Eastern terminals, leaving Busan to compete for those shipments that benefit from its additional connections. Neither Russian service approaches the scale of Busan’s overall transshipment business, but both show that the Korean port participates in a market linking maritime freight to Eurasian inland transport, as well as the better-known routes across the Pacific and to Europe.
The Russian services operate under legal and financial restrictions absent from most of Busan’s Japan-related feeder business. South Korean and other restrictions on trade with Russia differ by product, counterparty and financial arrangement; the existence of an announced service does not establish that every potential shipment is permitted, or that every shipment is prohibited. FESCO says it operates within the management structure of the Russian state nuclear corporation Rosatom. Shipping companies and customers must assess cargo restrictions, sanctions exposure, banking and insurance conditions before using a service. The legal and financial uncertainty constrains the addressable market even when vessels and terminals are available. Russia-related transport may offer business to Busan, but a shipping line’s announced departure frequency is not a forecast of regional economic benefit.
Japanese participation in Russian energy projects follows a different commercial and regulatory logic from its container-shipping policy. Tokyo seeks dependable global container access while retaining limited energy interests in Russia despite a sharp contraction in bilateral trade following the invasion of Ukraine. Russian Far Eastern container logistics and Russian Arctic energy shipments operate under different cargo demands and policy constraints. Treating Japan, Vladivostok and the Northern Sea Route as one emerging northern corridor would conflate services that have different customers and commercial purposes. Busan’s value lies partly in accommodating separate connections, not in forcing them into a single geopolitical trade route.
What a Busan Transshipment Connection Costs
A feeder arriving from Japan may discharge containers at one New Port terminal while the Europe-bound vessel is booked at another. Trucks, terminal gates, yard equipment and vessel-loading schedules must then align within the time available before departure. Additional equipment and handling cost money, and a missed sailing can impose several days of delay if there is no suitable replacement connection. A carrier can quote a through freight rate to the exporter while managing a chain of independently operated facilities behind that price.
New Port processed roughly 18.64 million TEUs in 2025, including 11.91 million TEUs of transshipment, and accounted for about 84 percent of Busan’s transfer handling. Its expansion has concentrated international cargo in larger, modern facilities, yet separate terminal operators still complicate some inter-terminal movements. The Ministry of Oceans and Fisheries cited 2.32 million TEUs of inter-terminal transshipment and 55.1 billion won in associated additional logistics costs for 2023. A later port-authority estimate referred to about five million TEUs of annual inter-terminal movement on a different or insufficiently defined basis. The two figures should not be used to claim that transfers doubled. They nevertheless identify a substantial activity that carriers would prefer to complete with less uncertainty and expense.
Busan Port Authority’s Transshipment Shuttle System was designed to coordinate transport orders and reduce empty truck journeys. A three-month trial in 2023 reported average terminal waiting times of 12.1 minutes for participating trucks, compared with 22.6 minutes across the port. Participation was limited, and the comparison does not isolate the software’s causal impact from differences between vehicles and assignments. The operating logic is sound: a truck carrying a container into one terminal can reduce wasted mileage if it collects another on the return journey. Whether the system delivers sustained port-wide savings requires comparable operating data after expansion.
ONE’s stake in Dongwon Global Terminal Busan addresses a related concern from the shipping company’s side. Its terminal partnership seeks more predictable access to berths and better management of transshipment cargo; the terminal’s planned fully developed capacity of more than 4.5 million TEUs, with five main berths and a feeder berth, is a future capacity figure rather than actual 2026 handling. The investment suggests that the quality of terminal access has become important enough for a global carrier to commit capital. Exclusive operating benefits, changes in punctuality and the balance of bargaining power between terminals and shipping lines cannot be inferred from the announcement alone.
The financial benefits of all these activities must be distinguished. A port authority earns rental and other revenues, terminal operators charge for handling, and transport firms are paid to move containers. The charges are also costs to shipping lines and cargo owners. The ministry’s estimate of approximately 150,000 won of economic value for a transshipment TEU includes charges and services that are not equivalent to net value added in Busan. In 2025 the port authority reported revenue of 404.9 billion won and net profit of 43.9 billion won, but these are the authority’s accounts, not the consolidated earnings of every terminal or logistics business. New Port’s facilities extend across the Busan–Changwon administrative boundary, making the local distribution of employment and income even harder to infer from port totals.
Singapore handled 44.66 million TEUs in 2025 and sold 56.77 million metric tons of marine fuel, according to its maritime authority. The businesses surrounding its shipping traffic include fuel supply, vessel management and professional services, although neither figure tells how much net value added those services generated. Rotterdam made a different commercial choice: its port authority reported a 16 percent decline in transshipment in 2025 after scarce terminal space was allocated in part to cargo moving to and from Europe’s inland market. Rotterdam’s inland cargo market differs markedly from Busan’s dependence on international transfers, but its capacity allocation illustrates how an additional terminal move can be less valuable than another use of the same berth or yard space. Busan could expand technical services, ship repair, alternative-fuel supply and maritime finance around its existing calls, but South Korea’s national shipbuilding expertise and finance institutions are not evidence that the resulting contracts will be booked or taxed in Busan. Carrier reliability, terminal returns, local employment and maritime-service income require separate measures.
The Arctic Route’s Cargo Economics
South Korea’s Panstar Acro completed an Arctic round trip in October 2026, cutting the sailing distance between Northeast Asia and northern Europe. The commercial record reveals a more demanding issue than nautical miles: a carrier needs paying cargo, workable departure dates and profitable use of the ship over its entire operating cycle. Its westbound journey from Busan to Felixstowe took roughly 20 days, carrying 737 TEUs of loaded exports and 202 TEUs of empty containers. It returned to Busan on October 11 with 1,743 TEUs of empty equipment and no loaded import cargo. The completed voyage demonstrated seasonal navigability for that ship; its manifest and published travel times did not establish a repeatable, profitable round-trip service.
China’s Sea Legend assembled a larger seasonal program, announcing eight westbound departures with a preliminary reported westbound export volume exceeding 14,000 TEUs. Cargo included batteries, energy-storage equipment and other manufactured products collected through Chinese ports. In October the operator said some vessels had reached Europe while others faced weather-related delays near northern Norway. Its executive also told a Chinese newspaper that freight rates were roughly twice conventional sea freight, a sales-market comparison unsupported by independently verified matched invoices. Chinese manufacturers may pay a premium for seasonal delivery speed, but the eight departures are not proof of eight profitable return voyages. Some vessels used Suez for their return voyages, demonstrating the need to deploy ships across a wider operating network rather than treat each Arctic crossing as an isolated trip.
Cargo record / Panstar Acro / 2026 round trip
The Arctic return carried no loaded imports
The same ship made both Arctic passages. Its reported container mix changed sharply between the Europe-bound and Busan-bound legs.
Outbound: Busan to Europe, August–September 2026
Return: arrived Busan, October 11, 2026 (KST)
Europe-bound manifest · 939 TEU in total
Loaded exports · 737 TEU
Empty containers · 202 TEU
Busan-bound manifest · 1,743 TEU in total
Loaded imports · 0 TEU
Empty containers · 1,743 TEU
Reading the bars: both lengths use the same reference of 1,743 TEU, the reported return total. The pale remainder on the outbound line is comparison space, not unused vessel capacity.
Loaded containers are not necessarily verified paid freight. The manifest shows equipment and cargo mix, not revenue, costs or annual service feasibility.
Sources: Centre for High North Logistics, 2026 AIS-based round-trip analysis using final South Korean ministry cargo figures; PanStar, August 23 departure notice. CHNL recorded arrival October 10 at 23:30 UTC, equivalent to October 11 in Korea.
The wider Northern Sea Route is not principally a container corridor connecting Japan and northern Europe. The Centre for High North Logistics identified 104 completed Arctic transit passages by September 30, 2026, estimating 3.7 million metric tons of cargo, much of it crude oil and bulk commodities connected to Russian ports. Only four completed voyages in that interim dataset linked Asian and European ports without Russia as either the origin or final destination. The center’s AIS-based cargo estimates and confirmed-transit definition are distinct from Russian projections for the full year and from Chinese reports counting departures. Rising Arctic traffic therefore cannot be translated into an equivalent increase in international container demand available to Busan.
Russia’s strategic interest in the Arctic includes energy exports, domestic access to its northern territories and the administration of the sea passage itself. Foreign operators must navigate Russian permitting requirements, applicable maritime safety rules and sanctions-sensitive commercial arrangements, while the legal interpretation of coastal-state authority remains contested. Seasonal ice and weather can disrupt schedules even as the Arctic warms. Black-carbon emissions and other ecological costs further complicate claims that a shorter route automatically offers a lower environmental burden. The business case changes again when a carrier compares a polar voyage with a Suez passage or the longer Cape of Good Hope route: those conventional itineraries have themselves changed during periods of Red Sea insecurity. ONE’s published 2026 FE4 rotation initially specified the Cape route, while Maersk’s August AE19 update announced a return through Suez. A single mileage comparison cannot represent every carrier’s real alternative.
The scale of conventional Asia–Europe liner shipping creates a further cost barrier. A 2025 academic model of the Busan–Rotterdam trade estimated $726 per TEU for a 20,000-TEU ship via Suez and $1,128 for a 4,300-TEU ice-class ship using the Northern Sea Route. The study compared different vessels under modeled assumptions, not realized freight rates on competing 2026 services. It nevertheless showed the cost that shorter sailing distance must overcome: large conventional ships can distribute capital and operating expenses over far more container slots, while polar navigation adds specialized requirements. Even a fast Arctic westbound voyage may be unattractive if the carrier lacks loaded cargo for the return or profitable employment outside the navigation season.
Busan might attract a seasonal service collecting Korean exports and Japanese feeder cargo, but another transfer may erode the advantage sought by shippers paying for speed. Sea Legend’s direct departure from Chinese ports demonstrates that new Arctic routes can bypass the Korean hub altogether. Ship repair, ice-capable vessel engineering, fuel supply, voyage support and maritime finance offer other possible businesses. Their customers would have to be won against competing service centers, and the demand would not necessarily be proportional to Busan’s container volumes. Existing Russian Far East services do not establish demand for these Arctic-specific facilities; they serve different routes and cargo markets.
The Economics of Busan’s Next Port Expansion
South Korea’s development plans include new automated facilities and the multistage construction of Jinhae New Port. The first three planned Jinhae container berths carry a stated project cost of 1.72 trillion won and a construction schedule extending through 2030. An earlier government strategy envisioned an integrated operator for nine berths in a subsequent configuration; the nine-berth concept should not be mistaken for facilities already built. The first three-berth project passed a 2021 reassessment with a benefit-cost ratio of 0.97 and a broader composite evaluation score of 0.556. The appraisal supported proceeding despite quantified benefits falling short of costs under its assumptions. The figures do not predict the operating profit of every future berth or settle the value of the entire multistage development.
Additional berth and yard capacity can protect services against congestion when large vessels arrive together. Terminal consolidation and coordinated transfer systems could also reduce the costs already incurred by ships using Busan. These potential returns differ from those of a specialized Arctic terminal, a ship-repair yard or a new fuel facility. Existing transfer volumes, truck movements, missed connections and carrier commitments offer ways to test some operational investments. Arctic services require more speculative assumptions about season length, loaded cargo in both directions, vessel technology and the routes competing carriers will offer. An investment that can serve conventional and polar vessels may face less concentrated demand risk than an asset with only one seasonal customer market, but shared use still needs to be demonstrated.
A foreign carrier’s equity participation adds another layer to Korea’s port strategy. ONE’s commitment can anchor shipping activity and encourage efficient operations, yet a port authority must also consider how terminal access is allocated to other lines and whether benefits from a particular investment circulate through the local economy. The revenue retained by a public landlord, the profit earned by a terminal company and the freight savings enjoyed by overseas customers are different outcomes. A higher transshipment total could coexist with tighter terminal margins or a costly expansion; a relatively small service business might create more local income than its TEU count suggests. Reliable comparisons require the contract, operating and regional value-added data that remain largely unavailable in public sources.
ONE’s investment in DGT represents a different kind of commitment from a temporary diversion after a Chinese port closure: the carrier now has capital exposed to the quality of a facility it intends to use. That commitment may help sustain connecting services, but Japan’s efforts to preserve direct calls, China’s industrial cargo base and the regulatory limits of Russian trade continue to shape which shipments reach Busan. Arctic container services introduce another way for cargo to move directly from Chinese production centers to Europe. A public port authority cannot secure that traffic by adding capacity alone. Carrier contracts, measured connection reliability and the income retained by terminal, logistics and maritime-service businesses will determine whether Busan’s next investments justify their long operating lives.
Continue this reporting
Reporting on the same issue
Related coverage selected from the article's desk, topics and newsroom relationships.
 NewsNov 3, 2026
Busan’s Smart Senior Centers and the Social Geography of Aging
Busan’s smart senior center plan meets an uneven city: older residents’ acces...
 NewsNov 2, 2026
Where Busan’s Patients Go—and What Its Hospitals Can Provide
Busan is expanding university hospital capacity as cancer patients travel for...
 NewsOct 27, 2026
Where Busan’s New Density Meets the Old City
Busan’s Beomil and Munhyeon districts are gaining homes and financial offices...
More from the author
More from this byline
Stay with the same line of reporting through more work from this byline.
 NewsOct 28, 2026
After the Expo, Busan Is Negotiating a Different North Port
 NewsOct 26, 2026
What It Took to Feed Busan
Reader Signal
Community readWhat did this report leave you with?
Choose the signal that best reflects your reading. Select it again to remove it.
One response per article
No response selected
A moderated conversation about the reporting.
One-level replies and newsroom moderation keep the conversation anchored to this article.
Discussion Status
Open
Please sign in to join the discussion.
Newsletter
Weekly reporting and context from Busan and Korea.