The Hidden Economics of South Korea’s Public Transport
Busan’s latest transport review exposes a wider national problem: South Korea’s integrated transit network is financed through fragmented local ledgers, rising operating costs and increasingly uneven fiscal burdens.

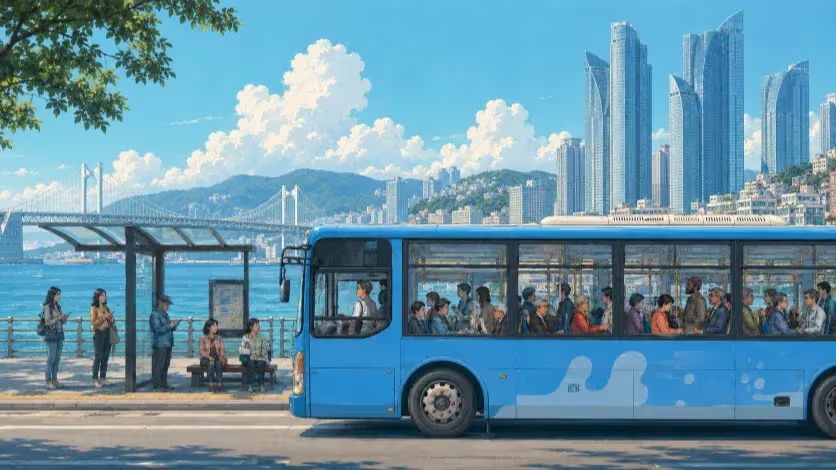
South Korea built an unusually affordable and integrated public transport system by shifting much of the financial risk away from individual bus routes while leaving operations largely in private hands. Two decades later, rising operating costs, an ageing workforce, regional population decline and expanding mobility obligations are testing the institutional bargain beneath the fare card. The next reform will depend less on whether public transport receives subsidies than on whether governments can identify what those subsidies are buying.
How much did Daejeon spend supporting its city buses in 2019? The answer can reasonably be ₩20.1 billion or approximately ₩57.8 billion, depending on what “support” is supposed to mean. Daejeon’s official operating statement recorded ₩206.0 billion in total bus costs, financed by ₩145.6 billion in transport revenue, ₩37.7 billion in compensation for free transfers, ₩20.1 billion in direct financial support and ₩2.6 billion in fuel support. Combining the direct subsidy with transfer compensation produces the larger figure; preserving the city’s own accounting distinction produces the smaller one. The discrepancy does not arise from faulty arithmetic. It arises because the cost of operating buses and the cost of a public fare policy are economically different things that can be grouped together or separated depending on the ledger being used.
Passengers encounter almost none of that institutional complexity. A bus can feed into an urban railway, another bus can complete the trip, and a transit card can calculate the transfer without requiring the rider to know which company operates each service or which government ultimately carries the cost. Seoul’s 2004 reform reorganized buses into trunk and feeder functions, introduced an integrated distance-based fare structure and placed buses and rail within a common transfer system. Busan adopted a revenue-pooling semi-public system in May 2007 and extended integrated transfers across buses and urban rail, later incorporating village buses. The passenger-facing result is one of the defining achievements of Korean urban transport: separately operated services increasingly function as parts of a single network.
The financial system beneath that network remains much less integrated. Local governments developed semi-public bus systems through different ordinances, operator agreements, compensation programs and settlement rules. A transfer discount can appear inside a broad bus-support figure in one jurisdiction and outside it in another; an operating deficit can be economically incurred in one year and paid partly in a later year; capital spending on zero-emission vehicles can be discussed alongside recurring operating losses even though the two expenditures serve different purposes. National comparisons can therefore measure genuine differences in cost while also capturing differences in accounting boundaries.
Busan’s current attempt to reconsider its transport system brings the distinction into immediate focus. A ₩194 million study conducted from April 2025 through May 8, 2026, recalculated standard operating costs using actual financial data from 2022 through 2024 and reviewed labor, fuel, maintenance, insurance, depreciation, depot costs, efficiency, settlement procedures and standard accounting rules. On May 20, twelve days after the study period ended, the city issued a separate tender for a ₩700 million, 24-month “full review” of its public transport operating system. The project was re-tendered in June, and proposal evaluations took place on July 8. The two assignments do not have identical scopes, but their proximity illustrates the point at which better cost calculation stops being the same problem as institutional reform.
Busan has been asking versions of the institutional question for years. A 2019 reform program identified 18 measures, including route tendering, an accounting-sharing system, stronger external audits, public disclosure of company information, competition, incentives for cost savings, limits on financial support and encouragement of larger corporate structures. The city described the reform at the time as a response to excessive expenditures, false employee registrations, inflated operating costs and declining public confidence. The existence of that earlier agenda changes the meaning of the 2026 review. The policy challenge no longer consists merely of identifying familiar weaknesses; it also involves determining why earlier remedies did not resolve them and which parts of the problem cannot be solved by another adjustment to the standard-cost formula.
Financial pressure has made that distinction harder to defer. During a 2025 Busan City Council review, a council member placed the semi-public bus system’s transport loss at roughly ₩350 billion in 2024 and about ₩430 billion in 2025; the city’s transport chief agreed with the latter figure. The same exchange identified ₩160 billion in the original budget, ₩50 billion in the first supplementary budget and ₩65 billion in the second, leaving about ₩150 billion against the projected annual loss. The official said any remaining shortage that could not be secured through additional appropriations would have to be financed through borrowing within the revenue-pooling structure. The cost generated by service, the cash appropriated by the city and the liability created when payment is deferred were therefore three different fiscal quantities attached to the same network.
The resulting question extends well beyond Busan. South Korea is preparing to place semi-public city-bus systems on a more standardized national legal footing at the same time that demographic and spatial changes are making local transport harder to finance. The Ministry of Land, Infrastructure and Transport’s 2026 agenda calls for legislation and standardization of systems that currently depend largely on local ordinances and agreements, alongside a Basic Transport Act, minimum transport-service standards and metropolitan demand-responsive transport. Regional development policy is also seeking to build 60-minute public-transport living zones across larger economic regions. A transport system that increasingly serves national social and economic goals is approaching a point at which fragmented local accounting and operating arrangements become part of the policy problem itself.
The Bargain That Made Integration Possible
The semi-public model emerged because private ownership and metropolitan network planning produced conflicting incentives. Before Seoul’s 2004 overhaul, operators had much stronger commercial interests in the passengers and revenue attached to particular routes. A route could be poorly designed from the perspective of the entire metropolitan network while remaining valuable to the company controlling it, and a socially useful feeder could be commercially unattractive even when the service increased the value of a railway or trunk corridor. Government could regulate fares and approve routes, but regulatory authority alone did not eliminate the financial resistance created when network restructuring transferred revenue from one company to another.
Seoul changed the relationship between operating a route and owning the revenue generated by that route. The July 2004 reform reorganized the network, introduced integrated distance-based fares and T-money, and placed operating revenue under a common management structure in which the city compensated recognized costs when total revenue was insufficient. Seoul’s current description of the semi-public model explicitly identifies pooled revenue, standard transport costs and public coverage of the remaining gap as core features of the system. The arrangement gave public authorities considerably more room to design buses as part of a network rather than a collection of independent commercial lines.
Revenue pooling had value precisely because the economics of an integrated network do not stop at the fare collected on an individual bus. A feeder route may carry fewer passengers than a central trunk line while materially increasing the usefulness of the railway to which it connects. A transfer discount can lower the revenue associated with an individual boarding while making the combined journey affordable enough to compete with the automobile. Public authorities can treat those effects as network benefits; an individual operator whose survival depends directly on a single route’s revenue has much less reason to do so.
Busan adopted a comparable institutional bargain in 2007. The city describes its semi-public system as a hybrid in which municipal government controls route adjustment, fare decisions and operating supervision, while private bus companies manage operations and labor and revenue is jointly managed. Busan’s stated reasons for adoption included declining bus ridership, rising congestion and operating costs, regulated fares, deteriorating company finances and the risk that operators would cut or shorten unprofitable routes. The semi-public arrangement allowed policy routes and integrated transfers to survive commercial pressures that might otherwise have reduced service.
The arrangement was therefore more than a mechanism for subsidizing private firms. It represented a transfer of part of the commercial risk to government in exchange for stronger public control over the network. Full municipalization would have required government to acquire or reproduce extensive operating assets and organizational capacity. Revenue pooling allowed cities to obtain much of the coordination associated with public planning while leaving day-to-day operation in private hands.
Greater stability altered incentives as well. A company protected from much of the direct revenue risk associated with declining ridership does not face the same market pressure as an operator whose survival depends on route-level profitability. Recognized labor, fuel, maintenance and depreciation expenses can enter a standard-cost settlement rather than remain entirely with the company. Public authorities consequently inherit the difficult task of determining what an operator should reasonably cost, auditing the calculation and ensuring that financial protection does not become permanent insulation from performance pressure.
The existing Korean systems are not devoid of performance controls. Seoul describes evaluation and incentives as achievements of the semi-public model, and Busan’s reform programs have repeatedly sought stronger audits, transparency and competition. The policy question is narrower than a claim that operators face no discipline. The more consequential issue is how strongly performance, cost and continued access to publicly financed routes are connected, and whether public authorities retain credible mechanisms for changing an operator or operating model when evidence shows persistent underperformance.
Fare policy adds another complication. Seoul’s official 2024 figures place average city-bus transport cost at ₩1,440 per passenger against an average collected fare of ₩938, meaning fares covered 65.1 percent of reported passenger cost and left a gap of ₩502. The existence of the gap does not establish that 34.9 percent of the system is inefficient. Affordable fares, transfer integration, coverage of weak routes and other public objectives intentionally shift part of the cost away from the farebox.
Busan officials have made a related argument about fare restraint. During the 2025 council discussion over rising losses, the transport chief noted that fares had been raised only about three times since the introduction of the semi-public system, compared with much more frequent increases under the earlier private regime. Fare freezes do not explain every increase in public support, but regulated passenger prices inevitably affect the amount government must cover when wages, energy and other production costs rise. The operating deficit consequently contains both management outcomes and political choices about what passengers should pay.
The distinction is essential to any serious assessment of the model. Public money can compensate avoidable inefficiency, but it can also purchase an integrated transfer, a low-demand route, a late-night service, safer working conditions or cleaner vehicles. The same won cannot be classified analytically until the purpose of the payment is known.
One Card, Many Ledgers
The scale of public support has increased enough to demand scrutiny. A 2026 analysis by the Citizens’ Coalition for Economic Justice, based on information-disclosure requests to local governments, found that reported bus financial support nationwide increased from ₩1.9795 trillion in 2019 to ₩4.1002 trillion in 2024, while recorded passenger journeys fell from about 4.22 billion to 3.69 billion. Simple division raises reported support per boarding from roughly ₩469 to ₩1,112. The increase is real as a measure of the public money captured by the dataset, but the total is not a nationally harmonized measure of one identical accounting category.
Daejeon demonstrates why the distinction matters. Its 2019 operating statement separated the ₩37.7 billion cost of free transfers from ₩20.1 billion in direct financial support. A national aggregation that places both inside a wider subsidy category measures the overall public contribution more comprehensively, but it simultaneously changes the question being asked. The cost of an integrated fare policy becomes indistinguishable from the amount required to cover an ordinary operating gap.
Gwangju provides an unusually clear contrast because the city publishes a long-running series in which transport cost, operating revenue and financial support align directly. In 2024, Gwangju reported transport costs of ₩243.7 billion, revenue of ₩107.3 billion and financial support of ₩136.4 billion. The published support figure is effectively the difference between cost and revenue. The city therefore provides a relatively transparent view of the annual operating gap, although the clarity does not make the figure automatically comparable with another jurisdiction that incorporates additional fare or social policies into a broader support total.
Timing produces another form of incomparability. Seoul’s official financial-support series shows ₩170.5 billion in 2020, ₩456.1 billion in 2021, ₩811.4 billion in 2022, ₩891.5 billion in 2023 and ₩400.0 billion in 2024 before rising to ₩457.5 billion in 2025. The sharp changes should not be read mechanically as equivalent changes in the cost efficiency of bus operations. Annual appropriations and settlements can move differently from the economic gap produced during the year, just as Busan’s council records show that part of an expected annual shortfall can be carried through borrowing when budget appropriations are insufficient.
A meaningful national account would therefore separate several economic layers before attempting to compare operators or cities. The first layer is the operating gap: the cost of scheduled service not recovered through operating revenue. A second layer is fare policy, including free transfers and age- or income-based concessions. A third comprises public-service obligations such as weak, late-night, peripheral or rural routes maintained because government considers access socially necessary. Capital associated with zero-emission vehicles, chargers, depots or accessibility belongs in another category, while unpaid obligations and borrowing require a separate record of deferred liabilities and the interest generated by them.
The classification matters because the policy diagnosis changes with the layer. Rising operating cost can justify scrutiny of labor productivity, maintenance, procurement or management overhead. A growing transfer subsidy is primarily evidence about passenger pricing policy. Increased public-service expenditure may result from demographic decline that makes weak routes more expensive to maintain. Higher capital spending can reflect a deliberate decarbonization program. Debt interest can reveal the fiscal cost of failing to fund an obligation when the service was provided.
Common categories would not force Korean cities to adopt identical policies. Busan could continue choosing a different transfer structure from Daejeon, and Gwangju could maintain a different level of service from Seoul. Standardization would make those differences interpretable. Higher support resulting from a broad social policy would stop masquerading as the same economic phenomenon as higher support generated by an expensive operating structure.
The importance of comparability is already visible in the national reform agenda. The central government plans to legalize and standardize semi-public bus systems whose operating foundations currently reside largely in local ordinances and agreements. A common legal structure without a common financial vocabulary would still leave policymakers comparing unlike costs. Standardization of institutions will have limited analytical value if the ledger used to judge those institutions continues to change at each municipal boundary.
The Cost of Keeping the Network
The long-run sustainability problem is already visible in observed data. Gwangju recorded approximately 126.7 million bus passengers in 2019 and 104.6 million in 2024, a decline of 17.4 percent. Over the same period, annual transport costs rose from ₩203.5 billion to ₩243.7 billion, an increase of 19.8 percent, while financial support increased from ₩73.3 billion to ₩136.4 billion, or about 86 percent. Calculated from the city’s published figures, transport cost per recorded passenger rose from approximately ₩1,606 to ₩2,329, an increase of about 45 percent.
The calculation does not establish that Gwangju’s operators became 45 percent less efficient. Pandemic effects, inflation, wages, fuel costs, service levels and ridership all influence the ratio. The significance lies in the underlying arithmetic: passenger demand can decline while the total cost of preserving a network continues rising. A municipality cannot automatically reduce its bus system by the same percentage as its population or ridership because geographic coverage, minimum frequency and operating hours are partly fixed service obligations.
A simple long-run stress test illustrates the sensitivity. Using Seoul’s 2024 farebox relationship as a starting index, total passenger cost can be set at 100, fare revenue at 65.1 and the unfunded portion at 34.9. If passenger volume fell 9 percent by 2050 while real total costs and real fares remained constant, the gap would rise to about 40.8, roughly 17 percent above the baseline. Demographic decline alone produces pressure, but not the most severe scenario.
A persistent 1 percent annual increase in the real cost of providing the same broad level of service changes the result dramatically. Compounded over 26 years, the cost index reaches roughly 129.5. If passenger volume is 9 percent lower and real fares remain unchanged, the public-financing gap rises to approximately 70.3, about twice the initial level. Gradual fare adjustment and a 10 percent improvement in the resources required to produce equivalent accessibility would reduce the modeled gap substantially. The exercise is a sensitivity analysis rather than a forecast, but Gwangju’s observed record shows why unit-cost growth deserves at least as much attention as the headline decline in population.
Labor conditions make the problem more concrete. Data supplied by the Korea Transportation Safety Authority to a National Assembly member showed that the share of bus transport workers aged 60 or older rose from 26.3 percent in 2019 to 40 percent in 2024, while the share younger than 50 fell from 29.5 percent to 20.9 percent. Annual recipients of new bus-driver qualifications declined from 38,219 in 2019 to 24,722 in 2023. The figures cover bus transport workers more broadly than metropolitan city-bus drivers alone, but they document an industry in which older workers have become substantially more important while new entry has weakened.
Busan has already experienced a practical version of the shortage. The city and local bus associations held the industry’s first joint recruitment event in 2024 amid reports that companies were struggling to attract enough qualified drivers. Contemporary reporting described interrupted recruitment processes, reliance on retired drivers returning under temporary contracts and an industry that had once been considered an attractive local occupation but was increasingly competing with other driving and delivery jobs for workers. The evidence does not prove that Busan will be unable to staff its future network, but labor supply has ceased to be a purely theoretical 2050 problem.
National demographics will intensify the exposure. Statistics Korea’s current long-range projection places the working-age population at 36.33 million in 2024 and 24.45 million in 2050, a decline of about one-third. The next population projection is scheduled for December 2026, so the 2022–2072 series remains the latest official long-range baseline available as of August. A smaller labor pool does not translate mechanically into a one-third reduction in bus drivers, but occupations requiring early starts, late finishes, strict licensing and continuous geographic coverage will have to compete for workers in a much tighter market.
Ageing changes the value of the service at the same time. Statistics Korea projects one-person households to account for 39.6 percent of all households by 2050, while households headed by someone aged 65 or older approach 49.8 percent. The transport implications are not captured by assuming that every older person will make more bus trips. Smaller and older households can have fewer internal substitutes when driving becomes difficult, making reliable access to shopping, health care and other daily activities more consequential even if aggregate travel volumes eventually decline.
Research by the Korea Research Institute for Human Settlements provides empirical support for the accessibility argument. Its 2024 study of public transport in a super-aged society used household travel data, surveys of older residents and regional case studies and concluded that transport conditions materially affect the range of activities available to older people outside the largest urban centers. The study identified greater bus frequency and better access to facilities used by older residents as central policy priorities. Ageing therefore raises the value of dependable mobility without requiring the assumption that every elderly household will generate more travel.
Productivity will consequently have to mean something more sophisticated than service reduction. A municipality can improve its subsidy ratio quickly by widening headways, ending evening service earlier or cutting weak routes, but households then absorb part of the cost through longer waiting times, taxis, private automobiles or reduced access. Genuine productivity involves maintaining useful mobility with fewer resources through trunk-and-feeder redesign, improved rail-bus coordination, reduced dead mileage, smaller vehicles at low-demand times or demand-responsive services where conventional fixed routes no longer match the pattern of demand.
Automation may eventually alter the labor requirement for selected services, particularly where low ridership makes a dedicated driver the largest obstacle to maintaining frequency. The national government is pursuing autonomous public transport and demand-responsive systems as part of its mobility agenda. Early applications will still require remote supervision, maintenance, safety systems, insurance and capital, making the technology more useful as a service-production tool than as a presumed fiscal shortcut.
The same caution applies to electrification. Zero-emission buses may reduce energy and maintenance costs over their operating lives while requiring larger up-front expenditures for vehicles, batteries, charging systems and depots. Capital associated with national climate policy should remain visible separately from recurring operating performance. A city investing heavily in electrification should neither be labeled less efficient because its capital spending rises nor assumed to be efficient merely because more of its fleet is electric.
The 60-Minute Paradox
Korea’s regional strategy is simultaneously enlarging the geography that public transport is expected to serve. The national “5 poles, 3 special regions” framework calls for public-transport living zones connecting regional hubs within roughly one hour and combines metropolitan rail, BRT, regional buses, demand-responsive services, public taxis, transfer centers and integrated fares. The objective is broader than shorter travel times. Larger functional regions are intended to give residents access to employment, universities, hospitals and other services that individual municipalities may struggle to provide at sufficient scale.
The operating economics of regional integration differ from the politics of infrastructure announcements. Passengers rarely begin and end their journeys on railway platforms. Local buses, walking links, waiting times and feeder reliability determine whether a fast trunk line becomes a meaningful part of daily mobility. A railway that cuts twenty minutes from station-to-station travel can deliver far less practical value when a passenger waits forty minutes for the local bus at either end.
Capital investment and recurrent operation also sit in different budgets. Central government can participate directly in regional rail, BRT infrastructure and transfer centers, while the wages, energy and maintenance required to run feeder buses recur annually in municipal or provincial accounts. A national policy can therefore expand the economic geography of a region while leaving a significant share of the cost of accessing that region on local governments with shrinking populations and weaker fiscal bases.
Busan-Ulsan-Gyeongnam illustrates the mismatch. Employment, industrial supply chains, universities and health care already generate mobility across municipal boundaries. A bus financed by one city can increase the value of a railway or job center in another. The passenger experiences a regional labor market, but the feeder can remain a local fiscal responsibility whose benefits are evaluated primarily inside one jurisdiction.
Transport appraisal consequently needs to move beyond infrastructure quantity. Railway kilometers, travel speed and forecast boardings remain relevant, but jobs reachable within 45 or 60 minutes, hospitals reachable within a defined time and the proportion of residents connected to frequent service provide stronger measures of whether the entire network is changing economic access. Regional policy gains little from shortening the fastest segment of a trip while the first or last segment remains unreliable.
Minimum transport-service standards will sharpen the fiscal question. National government plans to develop such standards while also expanding demand-responsive transport, creating the possibility of defining mobility as an outcome rather than preserving the same mode everywhere. Dense corridors may require frequent buses, BRT or rail; low-density districts can use smaller vehicles, DRT or public taxis. The appropriate national obligation concerns the accessibility residents receive, while local delivery can vary according to geography.
Passenger-side policy is already moving toward national integration. K-pass, now branded through the expanded Everyone’s Card program, covers all 229 local governments and had roughly 5.09 million users as of April 2026. Central government can therefore affect the price paid by passengers across the country through a common mechanism even though the service behind the fare remains much more locally organized. The front end of the system is becoming national faster than the back end.
A larger regional mobility system will eventually require some form of recurrent cost sharing that reflects the geography of benefits rather than the location of a bus depot. National participation does not need to mean national operation of every route. The fiscal architecture can recognize that a local feeder supports national regional-development objectives and cross-boundary labor markets while leaving route design and daily operation with regional or local authorities.
What London and Singapore Actually Do Differently
International comparison offers little support for the proposition that public transport becomes sustainable once government stops subsidizing it. London and Singapore both combine strong public planning with private bus operation and substantial public assumption of network and revenue responsibilities. The useful difference concerns the way the public authority specifies the operating service and the conditions under which a private company retains the right to deliver it.
Transport for London determines routes and service requirements and tenders bus operation under Quality Incentive Contracts. The contracts are gross-cost arrangements, run for fixed periods of up to seven years and include bonuses and deductions linked to route-specific reliability standards. Passenger-revenue risk remains with the public authority, while an operator accepts contractual responsibility for supplying a defined service at the agreed price and quality.
Singapore separates the functions even more explicitly. Under the Bus Contracting Model, government owns bus assets, key infrastructure and systems, while the Land Transport Authority plans services. Four private companies operate 14 bus packages under contracts awarded through competitive tendering. Operators must deliver at least 96 percent of scheduled mileage for each service every month and are assessed against additional reliability and safety standards.
Korean semi-public systems historically developed around a different institutional center of gravity. Once revenue was pooled, municipal governments needed a method for determining the recognized labor, fuel, maintenance, depreciation and other costs of incumbent operators. Standard transport costs therefore became central to settlement. London and Singapore also require detailed knowledge of those input costs, but tendering provides an additional form of price discovery by asking qualified companies what they will charge to deliver a specified service for a limited period.
Competitive procurement is not automatically superior. Thin regional markets can produce too few credible bidders, large transport groups can dominate tenders, and unrealistic bids can later create pressure on wages or service quality. Fixed-term competition can also impose transaction and transition costs that a stable incumbent system avoids. Korean reform therefore does not require every bus route to be auctioned.
The more important institutional characteristic is contestability. A public authority financing the service needs a credible means of challenging persistent cost differences and replacing an operator or operating model when performance repeatedly fails to justify continuation. Asset control influences whether that possibility is real. An incumbent that controls indispensable depots, charging infrastructure or other operating assets can remain difficult to replace even if contracts are formally open.
Korea has precedents for a more conditional treatment of operating rights. Seoul’s original reform included route restructuring and more direct public control, while Busan’s 2019 reform agenda explicitly proposed policy-route tendering and stronger competition. The relevant question in 2026 is therefore not whether competition is foreign to the Korean model but why mechanisms identified in earlier reform programs have remained secondary to standard-cost settlement.
The international lesson is correspondingly limited but useful. Public revenue risk can coexist with private operation; public subsidy can coexist with contractual discipline; and integrated fares do not require operators to possess indefinite claims on publicly financed routes. Korea can preserve the passenger-facing system it already performs well while making the service purchase underneath it more explicit.
From Subsidy to Public Mobility Productivity
Financial support cannot function as a sufficient performance indicator because expenditure is an input rather than an outcome. A city can spend more because its companies have high costs, because buses run more frequently, because transfer discounts are broader or because a shrinking district continues to receive service that commercial demand can no longer sustain. Evaluation has to pair the money with the mobility produced.
Operational measurement should begin with service quantity. Public support per revenue vehicle-kilometer can identify the cost of placing scheduled service on the road, while support per revenue-hour reflects the cost of maintaining operation through time. Passenger-kilometers measure actual movement and avoid treating a short central-city boarding as economically identical to a much longer regional trip. Dead mileage, vehicle availability and cancellations can add operator-level evidence about how effectively paid inputs are converted into delivered service.
Quality measures prevent cost reduction from being confused with productivity. A route operating every ten minutes supplies a different level of mobility from one operating every hour, even if both remain present in an official route count. Reliability matters equally because a missed or badly coordinated transfer can erase much of the benefit created by a fast trunk service. Frequency, actual waiting time, cancelled trips and service span therefore belong beside financial data.
Accessibility provides the strongest link between transport operations and public purpose. Jobs reachable within 45 or 60 minutes, hospitals reachable within a defined time and the share of households within walking distance of frequent transit allow different technologies to be judged against a common outcome. A conventional bus, a DRT vehicle, BRT and rail can all create useful mobility even though their operating economics are different.
Environmental performance can be added without turning technology adoption into the outcome itself. Energy use or carbon emissions per passenger-kilometer connects fleet transition with actual service and ridership. Such measures also preserve an important distinction in climate policy: replacing an internal-combustion car with an electric car can reduce tailpipe emissions, but it does not solve congestion, parking demand or geographic exclusion from driving.
The combined approach can be described as Public Mobility Productivity: the usable mobility produced from public resources. The concept is more useful as a transparent dashboard than as a single ranking. Dense metropolitan routes and sparse regional networks operate under different structural conditions and should be compared with relevant peers, but both should be able to show what taxpayers receive in return for the resources committed.
Korea already possesses much of the underlying data. Transit cards record passenger movement at extraordinary scale, and vehicle systems record operation and location. Local governments and national agencies collect extensive information about fleets, routes and costs. The missing institutional link is a common structure connecting those operational records to comparable public accounts.
The resulting transparency would change the politics of subsidy as well. “Financial support for bus companies” invites a debate primarily about the size of transfers to private firms. An account separating ordinary operating gaps, integrated transfers, low-density public service, zero-emission investment and financing costs produces a different political question: which mobility outcomes does society want to purchase, and how efficiently are the responsible institutions delivering them?
The Next Contract
The evidence points toward reform of the institutional architecture rather than reversal of the passenger system. Pooled revenue, integrated fares and strong public route planning remain useful responses to the coordination problems that shaped Korean cities in the early 2000s. The weaknesses emerge in the conditions attached to public money, the comparability of local accounts and the durability of operating rights.
National accounting standards form the first unavoidable issue. Legal standardization of semi-public systems will have limited analytical value if operating gaps, fare-policy compensation, public-service obligations, capital spending and deferred liabilities continue to mean different things across cities. Local governments can retain different policies while using a common fiscal vocabulary.
Service specification follows from the same logic. Standard transport costs will remain relevant, particularly in markets where meaningful operator competition is difficult, but compensation can be tied more closely to verifiable service output. Scheduled kilometers, operating hours, missed trips, reliability and vehicle availability reveal what government actually purchased. Explicit identification of public-service obligations allows the cost of a socially necessary but weak route to be judged against the accessibility it preserves rather than mixed indiscriminately with avoidable operating inefficiency.
Fare policy requires its own account. Affordability remains one of the major strengths of the Korean network, but universal fare restraint and targeted affordability are different fiscal strategies. K-pass demonstrates that national government now possesses infrastructure capable of supporting passengers directly. Greater separation between the base fare, targeted social support and operator compensation could make the distribution of costs more transparent without abandoning the principle of affordable public transport.
Operating rights represent a third dimension. Public financing creates a reasonable expectation that continued access to the network should remain conditional on performance. Large metropolitan markets can make greater use of fixed-term contracts, periodic requalification or competitive route packages when genuine competition exists. Smaller regions can retain negotiated structures while strengthening performance conditions. The objective is a credible ability to change an operator or service model when evidence warrants change, rather than a uniform national procurement rule.
Asset policy can determine whether that ability exists in practice. Shared or publicly controlled depots, charging facilities and other bottleneck infrastructure can lower entry barriers without requiring government to acquire every bus company. Busan’s interest in larger operators should likewise be tested against actual cost structure. Corporate consolidation may reduce management overhead, but labor, vehicles, maintenance and energy remain large costs that do not disappear simply because two companies merge.
The fourth issue is the division between national and local finance. Central government increasingly defines mobility outcomes that extend beyond one municipality through minimum service standards, national fare support, regional economic integration and decarbonization. A service fulfilling a nationally defined obligation or producing benefits across several jurisdictions has a stronger claim on national co-financing than an ordinary local operating choice.
Central funding would create its own incentive problem if it simply replaced local deficit reimbursement with national deficit reimbursement. Common money requires common evidence. National participation can be tied to standardized accounts, transparent liabilities, operating data, external auditing and measurable accessibility. Greater fiscal solidarity would then arrive with greater comparability rather than weaken local incentives to control cost.
Regional governance becomes part of the same problem as functional travel markets expand beyond municipal boundaries. Busan, Ulsan and South Gyeongsang do not need to reproduce the institutional structure of the Seoul metropolitan area, but an increasingly integrated labor market cannot be governed indefinitely as unrelated local feeder budgets connected only by the passenger. Shared accessibility targets and explicit cost-sharing can turn rail, BRT, buses and DRT into parts of the same planning system.
Labor policy and decarbonization also need to sit inside the architecture rather than remain external shocks. A shortage of drivers can degrade reliability long before a route becomes unnecessary, making recruitment, working conditions and scheduling legitimate measures of service resilience. Zero-emission fleets can increase near-term capital needs while supporting national climate goals. Neither expenditure belongs invisibly inside a generic subsidy figure from which policymakers are then asked to infer whether a bus company is efficient.
The institutional shift ultimately concerns the object of public spending. Traditional settlement begins with the recognized cost of the operator and calculates the resources required to close the financial gap. A mobility-oriented framework begins with the accessibility and service government intends to preserve, identifies the resources necessary to produce those outcomes and determines which operating arrangement can deliver them under transparent conditions. The bus company remains important, but the company ceases to be the unit around which the entire fiscal question is organized.
Keep the Network, Rewrite the Contract
South Korea enters the next phase of public transport reform with assets that many countries would find difficult to recreate. Integrated payment, coordinated transfers, extensive urban networks, real-time passenger information and established habits of transit use allow riders to move through systems whose ownership and administrative boundaries are largely invisible at the point of travel. The semi-public model helped build that experience by giving local governments greater control over network design while avoiding wholesale acquisition of the private operating industry.
The demographic and fiscal environment underneath the model is changing faster than the passenger interface. Gwangju already demonstrates how a network can carry fewer passengers while total costs and public support rise. Bus-industry workforce data show a growing reliance on older drivers and weaker entry of younger workers. Household ageing increases the value of reliable access precisely as low-density service becomes more expensive to produce. Regional policy enlarges the economic geography passengers are expected to navigate while recurrent operating finance remains tied closely to local boundaries.
None of those pressures establishes that Korean public transport is failing. They establish that a system designed to solve the coordination problems of an earlier era is acquiring responsibilities that its financial and contractual architecture was not originally built to carry. A subsidy total alone cannot reveal whether the pressure comes from operating inefficiency, fare policy, regional coverage, labor scarcity, decarbonization or deferred payment.
Busan’s 2026 review provides an unusually clear test of whether the policy debate has moved far enough. The city already possesses a newly completed study of standard operating costs and an earlier reform agenda that identified route tendering, accounting reform, competition and financial limits. A broader system review will add little if it simply recalculates familiar costs with greater precision. The consequential questions concern risk, operating rights, multimodal network design, public-service obligations, deferred liabilities and the level of government responsible for financing mobility that increasingly extends beyond the city itself.
National reform faces the same test. Legal standardization can strengthen oversight, but common law without common accounting leaves policymakers comparing incompatible fiscal objects. A mobility right without a funding structure risks becoming an unfunded mandate in the jurisdictions least able to afford it. Regional rail without reliable local service can produce impressive infrastructure while leaving door-to-door accessibility largely unchanged.
The strongest elements of the current Korean model do not require dismantling. Private companies can continue operating buses, passenger revenue can remain pooled and integrated fares can remain a defining feature of the network. More comparable accounting, explicit public-service obligations, stronger performance conditions, greater contestability where markets can support it and a more coherent national-local financing arrangement would change the governance underneath the system rather than the system passengers have learned to rely on.
South Korea does not face the task of rescuing a failed public transport network. The harder task is preventing a successful passenger system from becoming institutionally obsolete. The previous reform era made different companies and modes appear coherent at the fare gate. The next one will be judged by whether the accounting, contracts and public responsibilities behind the journey can achieve the same degree of integration.
Continue this reporting
Reporting on the same issue
Related coverage selected from the article's desk, topics and newsroom relationships.
 NewsSep 26, 2026
South Korea’s 490 Regional Doctor Seats Begin a Longer Route to Care
South Korea’s first 490 regional-doctor seats tie medical-school admission to...
 NewsAug 11, 2026
Korea’s Innovation Cities Did Not Grow the Same Way
Nearly two decades after South Korea began relocating public institutions, th...
 NewsAug 8, 2026
A Climate Window Is Not a Shipping Lane
PANSTAR ACRO is scheduled to sail from Busan to Rotterdam through the Norther...
More from the author
More from this byline
Stay with the same line of reporting through more work from this byline.
 NewsSep 28, 2026
Why Some Commercial Space in Busan Is Hard to Reuse
 NewsSep 22, 2026
Busan Is Growing Westward as Its Waste Infrastructure Stays Put
Reader Signal
Community readWhat did this report leave you with?
Choose the signal that best reflects your reading. Select it again to remove it.
One response per article
No response selected
A moderated conversation about the reporting.
One-level replies and newsroom moderation keep the conversation anchored to this article.
Discussion Status
Open
Please sign in to join the discussion.
Newsletter
Weekly reporting and context from Busan and Korea.