Heat and exposure
Conditions are relatively manageable today, but humidity at 90% still matters for heat stress.
Climate Pulse
Busan Climate Pulse is the newsroom's live view of weather, air quality, coastal conditions, and the long-term warming trend shaping Busan's future.
Purpose
Connect the climate clock to the local evidence behind it.
Focus
Coastal heat, air quality, marine safety, and long-term warming.
Reporting
Local coverage first, with external references only where they add context.
Read the desk
Continue with newsroom coverage, topic hubs, and public climate references.
Conditions are relatively manageable today, but humidity at 90% still matters for heat stress.
Current AQI is 70 (Moderate). PM2.5 is 18.6µg/m³, which is the most important short-term public health signal on this page.
Busan's mean annual temperature is up about -0.71°C versus the early 1990s. Current sea surface temperature averages 23.9°C over the next 48 hours, with waves peaking near 0.4m.
Live dashboard
☀️ Current Weather: Real-time temperature, wind speed, humidity, and UV index in Busan. Helps with daily planning and weather safety.
🌫 Air Quality: PM2.5, PM10, ozone levels, and AQI index show air pollution levels and public health concerns.
🌊 Sea Temperature & Wave: 48-hour data showing wave height and sea temperature in Busan. Useful for marine safety and coastal monitoring.
📈 Climate Trend: Busan's average annual temperature from 1990–2023 shows a clear warming trend linked to climate change.
Climate Reporting
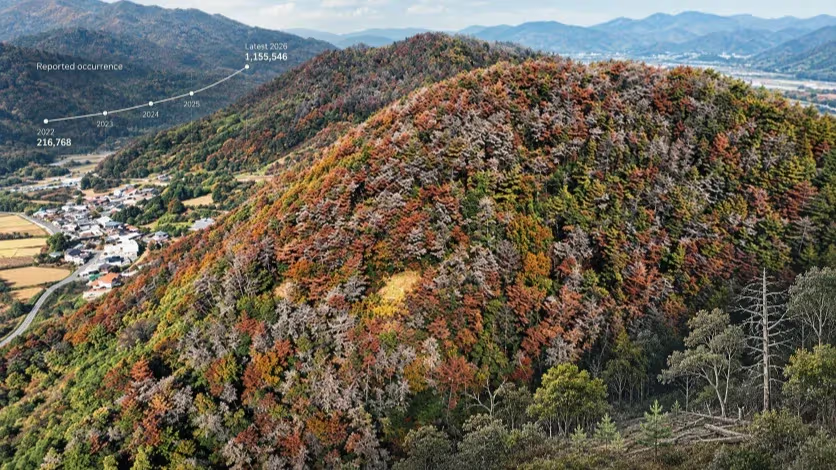
Gyeongnam’s pine-wilt outbreak has grown beyond a tree-removal problem. As reported occurrence passed 1.15 million, warmer transmission conditions, an extensive pine landscape and mass forest conversion began reshaping how southeastern Korea manages its forests.
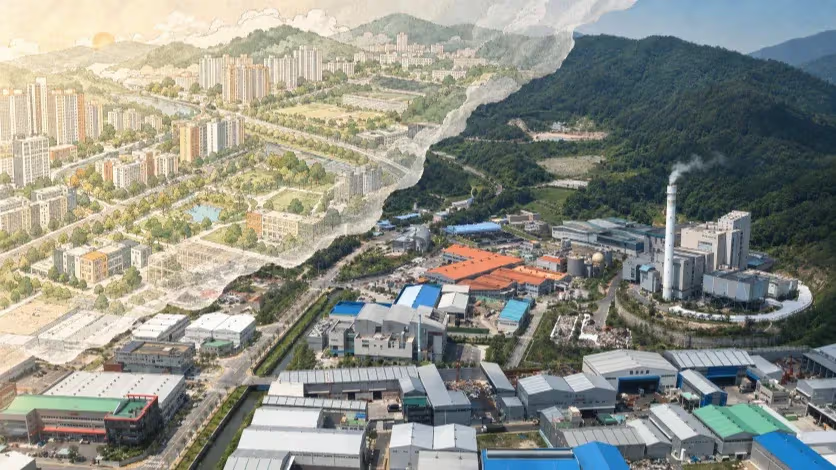

South Korea reported an 87 percent drop in aquaculture losses from high water temperatures in 2025. But data from major black rockfish farming waters show that local heat exposure, early harvest and emergency releases changed alongside farm protection.

Data sources